
This project was completed as a practice exercise through DataCamp's virtual environment. Using the product_emissions data set, I queried the most recent year's data to calculate the total carbon footprint (PCF) and number of unique companies across industry groups. The analysis used SQL techniques such as GROUP BY, COUNT(DISTINCT), SUM( ), and ORDER BY to identify the industries and countries contributing the most to product-related emissions.
This project explores industry-level carbon emissions using real-world data from The Carbon Catalogue on Nature.com. Data accessed via DataCamp’s learning environment for educational purposes.
Each PCF quantifies greenhouse gas emissions (in kg CO₂e) associated with a specific product — including emissions from upstream supply chains, company operations, and downstream distribution or disposal.
Why it matters?
Product-related emissions — from food to sneakers to electronics — make up over 75% of global emissions, offering a valuable lens to understand where reductions are needed most.

Photo by @frimufilms on Freepik
Since product-related emissions — from food to sneakers to electronics — contribute to more than 75% of global emissions, this dataset offers an excellent opportunity to explore where these emissions occur and how much each industry contributes.
product_emissions| Column | Data Type | Description |
|---|---|---|
| id | VARCHAR | Product ID |
| year | INT | Reporting year |
| product_name | VARCHAR | Product name |
| company | VARCHAR | Reporting company |
| country | VARCHAR | Country of incorporation |
| industry_group | VARCHAR | Industry group classification |
| weight_kg | NUMERIC | Product weight |
| carbon_footprint_pcf | NUMERIC | Carbon footprint in kg CO₂e |
| upstream_percent_total_pcf | VARCHAR | Emissions from supply chain |
| operations_percent_total_pcf | VARCHAR | Emissions from production |
| downstream_percent_total_pcf | VARCHAR | Emissions from distribution/use |
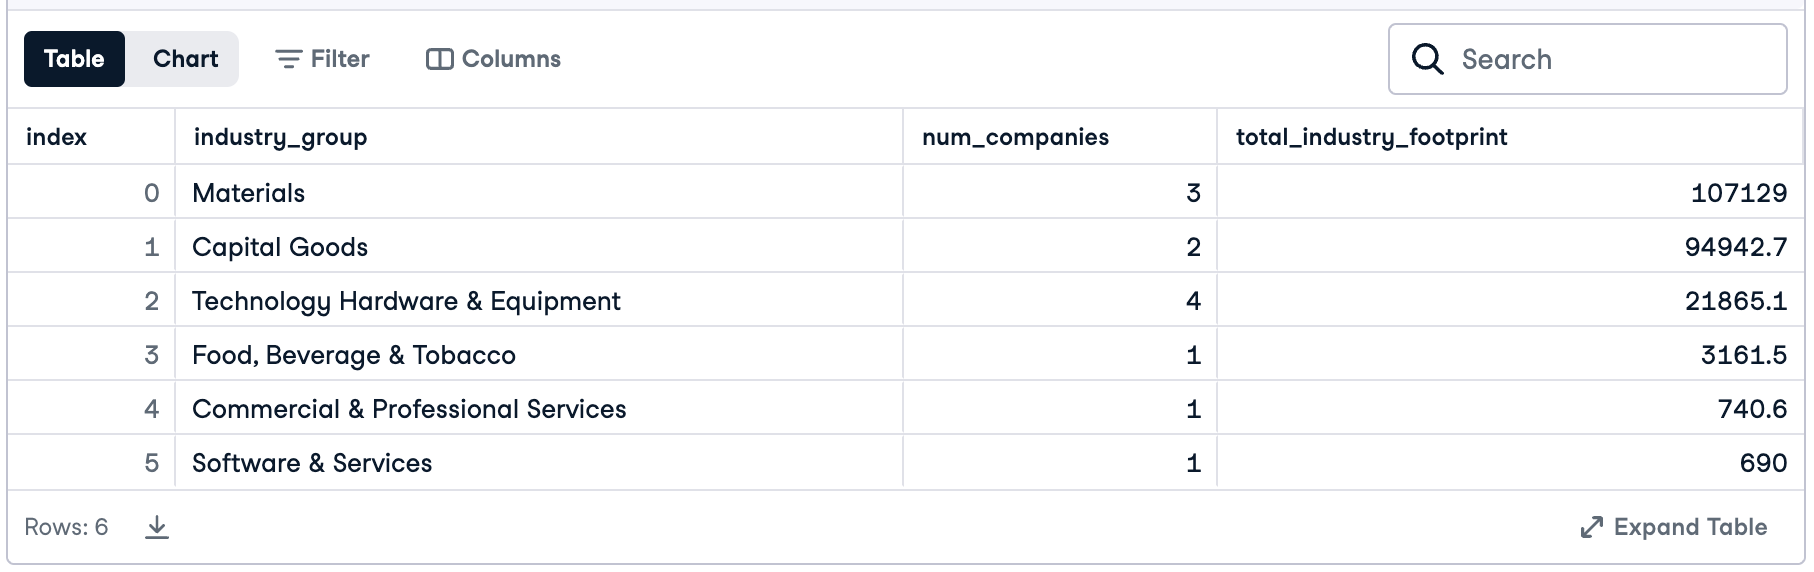
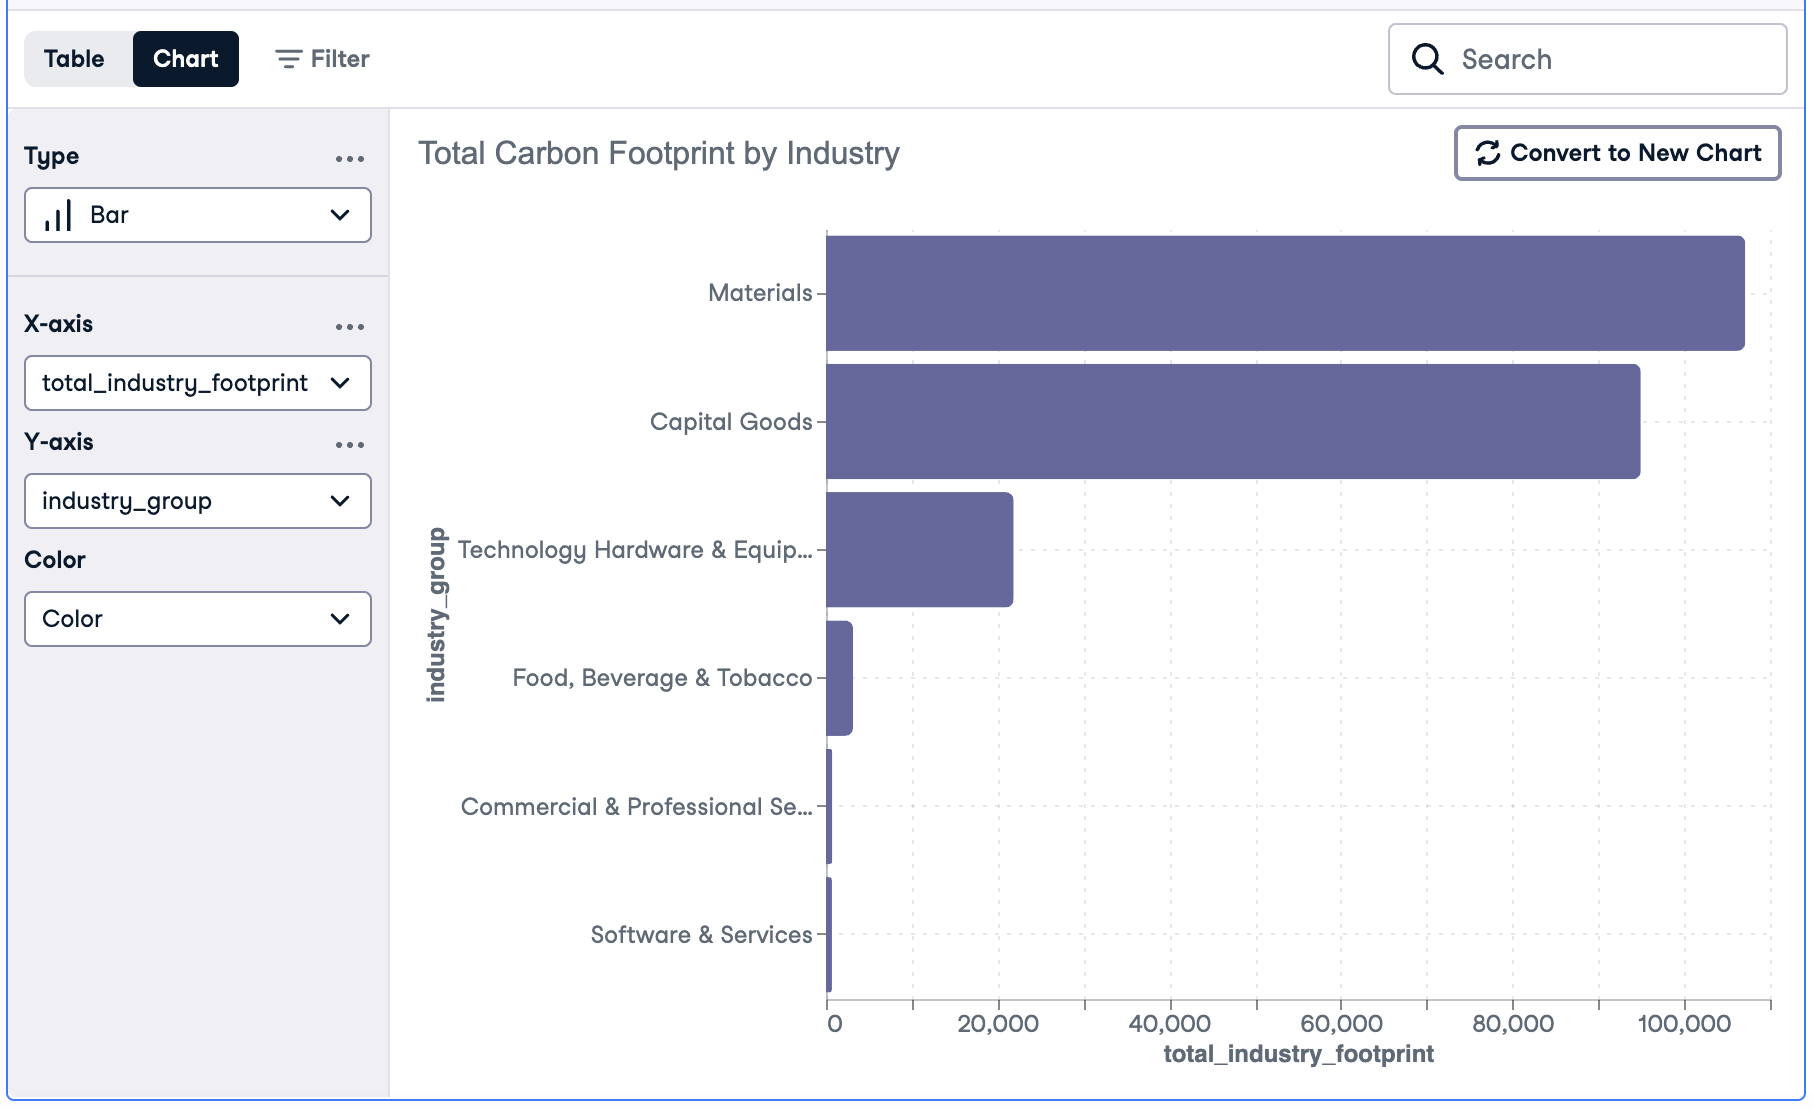
                        -- Total carbon footprint by industry group (most recent year)
                        SELECT industry_group,
                            COUNT(DISTINCT company) AS num_companies,
                            ROUND(SUM(carbon_footprint_pcf), 1) AS total_industry_footprint
                        FROM product_emissions
                        WHERE year = (SELECT MAX(year) FROM product_emissions)
                        GROUP BY industry_group
                        ORDER BY total_industry_footprint DESC;
This SQL query analyzes the product_emissions table to identify which industry groups contributed the most to carbon emissions in the most recent year available. It uses
COUNT(DISTINCT company) to count unique companies in each industry group and SUM(carbon_footprint_pcf) to calculate the total industry footprint. The results are grouped byindustry_group, rounded to one decimal place, and sorted in descending order of total emissions.
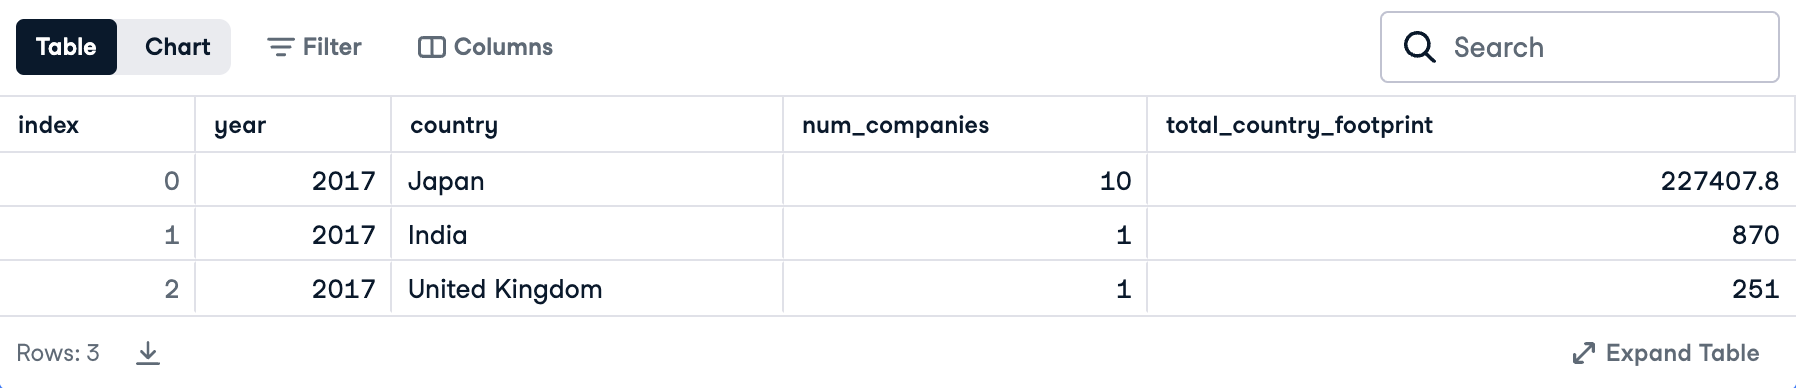
                        -- Total carbon footprint by country (most recent year)
                        SELECT year,
                            country,
                            COUNT(DISTINCT company) AS num_companies,
                            ROUND(SUM(carbon_footprint_pcf), 1) AS total_country_footprint
                        FROM product_emissions
                        WHERE year = (SELECT MAX(year) FROM product_emissions)
                        GROUP BY year, country
                        ORDER BY total_country_footprint DESC;
This query retrieves the total carbon footprint contributed by each country in the most recent year of available data to identify which countries had the highest overall emissions.
Thanks to DataCamp for providing the dataset and learning environment for this SQL project.